About
RGraph is a JavaScript charts library based on
HTML5 SVG and canvas. RGraph is mature (over 15 years
old) and has a wealth of features making it an ideal
choice to show charts on your website.
Download
Get the latest version of RGraph (version 6.17) from
the download page. There's also older versions available,
minified files and links to cdnjs.com hosted libraries.
License
RGraph can be used for free under the GPL or if
that doesn't suit your situation there's an
inexpensive (£99) commercial license available.The quadraticCurveTo function
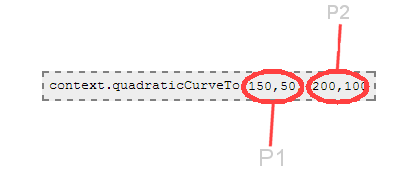
The quadraticCurveTo function can be used to add curves to
your canvas. It uses the existing pen position as the start
point and then the first two coordinates as the mid-point and the last two
coordinates that you give it as the endpoint.
The curve that is drawn will not necessarily pass through the mid-point.
Arguments to the function
- The X1 coordinate (of the mid-point, P1 on the diagram)
- The Y1 coordinate (of the mid-point, P1 on the diagram)
- The X2 coordinate (of the end-point, P2 on the diagram)
- The Y2 coordinate (of the end-point, P2 on the diagram)
P0 is not specified on the quadraticCurveTo function - this is done by a moveTo call before the
quadraticCurveTo call. As
shown below.
An example
<script>
    window.onload = function ()
    {
        var canvas  = document.getElementById("cvs");
        var context = canvas.getContext('2d');

        context.beginPath();

        // This is where the curve begins (P0)
        context.moveTo(100, 100);

        context.quadraticCurveTo(150, 50, 200, 100);

        context.stroke();
    }
</script>