The new clipping feature coming in the next release of RGraph
Written by Richard Heyes, RGraph author, on 16th February 2024The clipping feature
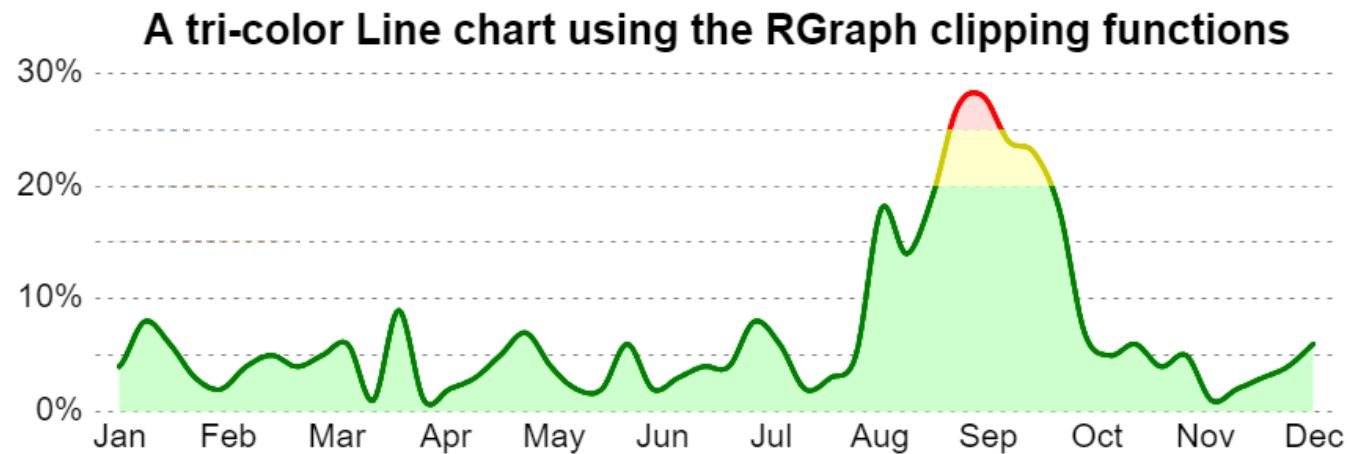
The next version of RGraph will include a new clipping feature which allows you to restrict the drawing to a certain area of thecanvas (for example the top half, a certain percentage of the canvas or an area based on scale values). This makes it very easy to make (for example) multi-color Line charts like the one depicted here (you can also find this chart in the demos/ folder in the download called line-clipping4.html).
This is the code that creates this chart:
<script>
    line = new RGraph.Line({
        id: 'cvs',
        data: data = [
            4,8,6,3,2,4,5,4,5,6,1,9,1,2,3,5,7,4,2,2,6,2,3,4,
            4,8,6,2,3,5,18,14,19,27,28,24,23,18,7,5,6,4,5,1,2,3,4,6
        ],
        options: {
            textSize: 15,
            yaxis: false,
            backgroundGridHlinesCount: 6,
            backgroundGridVlines: false,
            backgroundGridBorder: false,
            backgroundGridDashed: true,
            backgroundGridColor: 'gray',
            shadow: false,
            linewidth: 3,
            colors: ['red'],
            filled: true,
            filledColors:['#fdd'],
            marginInner: 15,
            marginLeft: 75,
            marginTop: 50,
            spline: true,
            xaxisTickmarksCount: 12,
            xaxisColor: 'gray',
            yaxisLabelsCount: 3,
            yaxisScaleUnitsPost: '%',
            textSize: 16,
            title: 'A tri-color Line chart using the RGraph clipping functions',
            titleSize: 20,
            clip: 'scale:25-max'
    }
    }).trace();


    new RGraph.Line({
        id: 'cvs',
        data: line.data,
        options: {
            ...line.properties,
            xaxis: false,
            yaxis: false,
            xaxisLabels: false,
            colors: ['#cc0'],
            filledColors: ['#ffc'],
            clip: 'scale:20-25'
        }
    }).trace();


    new RGraph.Line({
        id: 'cvs',
        data: line.data,
        options: {
            ...line.properties,
            xaxis: false,
            xaxisLabels: false,
            yaxis: false,
            colors: ['green'],
            filledColors: ['#cfc'],
            clip: 'scale:min-20',
            xaxisLabels: ['Jan','Feb','Mar','Apr','May','Jun','Jul','Aug','Sep','Oct','Nov','Dec']
        }
    }).trace();
</script>
The option that clips the canvas (ie restricts drawing to a certain area of the canvas) is highlighted in green and it can be a few different things:
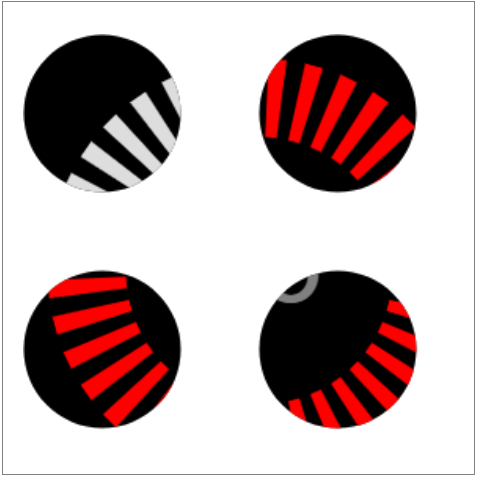
// Clip to scale values
clip: 'scale: min-20',
clip: 'scale: 20-25',
clip: 'scale: 25-max',

// Clip to halves of the canvas
clip: 'tophalf',
clip: 'bottomhalf',
clip: 'lefthalf',
clip: 'righthalf',
clip: 'righthalf',

// Clip to percentages of the X-axis
clip: x:0%-33.333%,
clip: x:33.333%-66.666%,
clip: x:66.666%-100%,

// Clip to percentages of the Y-axis
clip: y:0%-33.333%,
clip: y:33.333%-66.666%,
clip: y:66.666%-100%

// Clip to an RGraph style path string (quite versatile)
clip: 'b m 100 100 a 100 100 50 0 6.29 s #ddd'

Clip to an RGraph style path string that produces four circles
clip:    'b m 50 50 a 50 50 50 0 6.29 false '
       + 'm 200 200 a 200 200 50 0 6.29 false '
       + 'm 200 50 a 200 50 50 0 6.29 false '
       + 'm 50 200 a 50 200 50 0 6.29 false ',


// Clip to a polygon produced by an array of coordinates (a square in this case)
clip: [[0,0],[0,250],[600,250],[600,0]],

// Clip to a rectangle
clip: [10,10,50,50]
By using the RGraph path option you could create some rather interesting (albeit not terribly useful!) effects - such as this Segmented Meter chart which has been clipped to four circles - so you only see the chart where it overlaps those circles:
SVG structure changes
To better support svg charts, which have multiple different charts drawn on the svg tag at once, the structure has had to be changed. This will only affect you if you delve into the structure of the svg but it allows much better multiple chart support. For example, here's an example of the clip: feature when used on an svg Line chart:
<script>
    //  Separate out the configuration so that it can be easily
    //  reused for the second chart
    OPTIONS = {
        textSize: 16,
        marginLeft: 50,
        colors: ['green'],
        filled: true,
        filledColors: ['rgba(0,255,0,0.25)'],
        yaxisScaleMax: 20,
        yaxisScaleMin: -5,
        xaxisTickmarks: false,
        backgroundGridBorder: false,
        backgroundGridVlines: false,
        yaxis: false,
        spline: true,
        xaxisColor: '#666',
        xaxisLinewidth: 2,
        yaxisLabelsCount:10,
        tooltips: 'Quantity of sales: %{value}',
        tooltipsCss: {
            fontSize: '16pt'
        },
        title: 'A sample title for the chart',
        xaxisLabels: [
            '','Jan','','','Feb','','','Mar','',
            '','Apr','','','May','','','Jun','',
            '','Jul','','','Aug','','','Sep','',
            '','Oct','','','Nov','','','Dec',''
        ],
        linewidth: 2
    };


    //  Create the green part of the line
    line = new RGraph.SVG.Line({
        id: 'chart-container',
        data: DATA = [4,5,15,5,-3,-2,-1,-5,-5,5,13,9,11,18,5,1,3,5,5,-5,-4,-5,-2,3],
        options: {
            ...OPTIONS,
            clip: 'y:-50%-80%'
        }
    }).trace();


    //  Create the red part of the line
    line2 = new RGraph.SVG.Line({
        id: 'chart-container',
        data: DATA,
        options: {
            ...OPTIONS, //  Reuse the configuration
            clip: 'y:80%-150%',
            colors: ['red'],
            filledColors: ['rgba(255,0,0,0.25)'],
        }
    }).trace();
</script>
Other changes
There are a few other changes too (thus far) but they're more minor so these are the two stand-out changes.