Demos of charts
These are some of the example demo pages that come with the download archive. They run as soon as you extract it and are located in the demos/ directory. The majority of them run using just the RGraph libraries though a few do use the Google CDN hosted jQuery library.
There's over 1000 demos in the download archive - so when viewing the list of them in Google Chrome you can use the LinkClump Plus extension to make opening 100 (for example) of them at once a breeze. Similar extensions are available for other browsers.

More examples
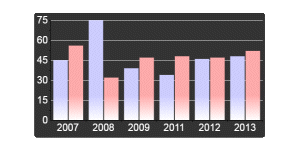
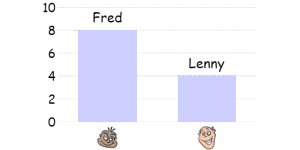
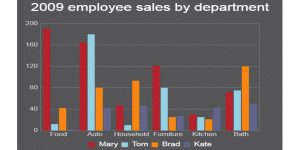
- An adjustable Bar chart
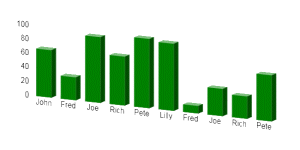
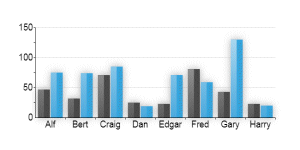
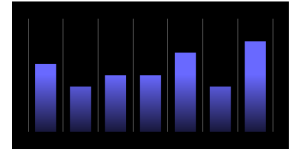
- A basic Bar chart
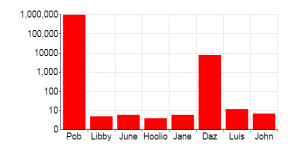
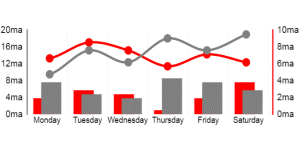
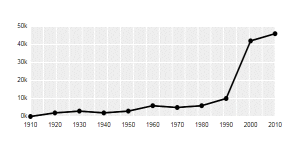
- Google's power usage
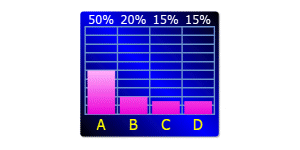
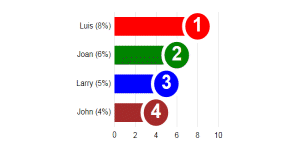
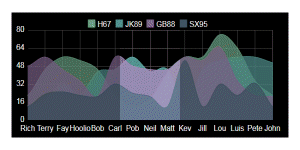
- An example of an interactive key
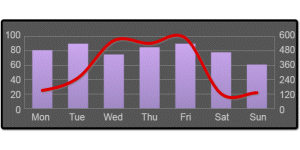
- A customised, adjustable Bar chart
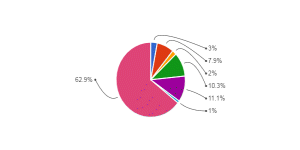
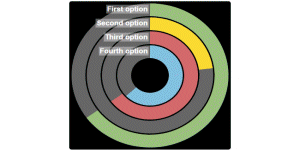
- A nested Donut chart
- A Horizontal Bar chart using the CSV reader
- A Horizontal Bar chart with formatted tooltips
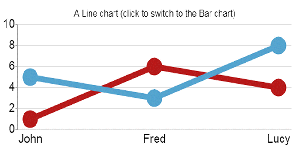
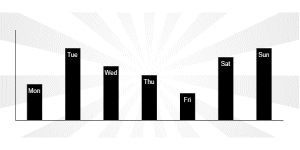
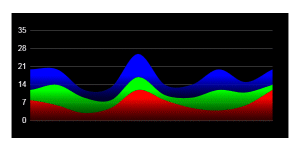
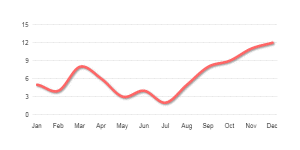
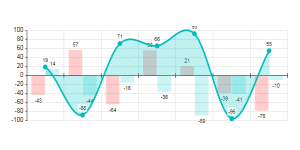
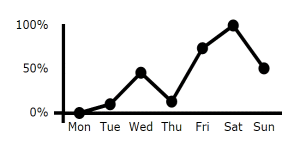
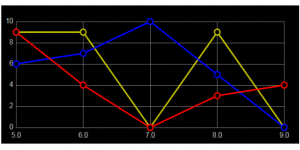
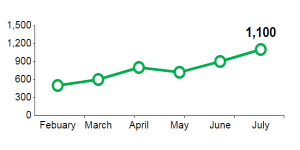
- A canvas-based black Line chart
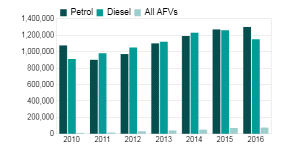
- A Line chart using the CSV reader
- A combined SVG Bar/HBar chart
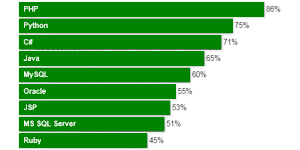
- blue SVG Horizontal Bar chart
- A black and orange SVG Horizontal Bar chart
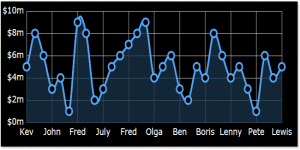
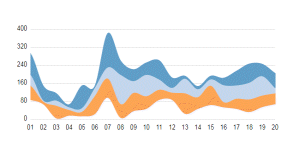
- A mock-up of Google Analytics
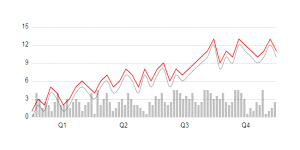
- A Line chart dashboard
- A dynamically updating Line
Demos on the RGraph blog
These are just a few examples - there are nearly 1000 more demo pages in the download archive. Also, the list below shows you more examples that are on the RGraph blog.
- New dumbbell variation (available on the SVG and canvas Bar chart and Horizontal Bar chart.
- New dual-color trendline demo pages
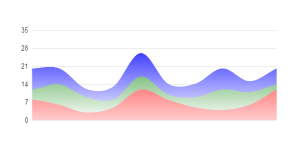
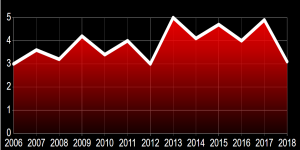
- A new example of a filled Line chart with alternating colors
- A new way to produce a vertical line chart
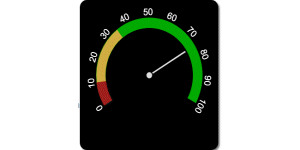
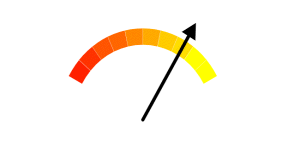
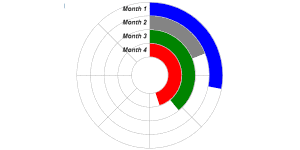
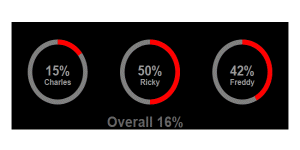
- New style of Semi-circular Progress meter
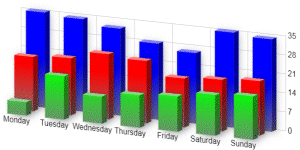
- A new 3D Bar chart demo
- Older demo added to the download archive
- New dual-color Line chart added to the download archive
- SVG Bipolar to support uneven data
- New Line chart Wave effect
- Updated multi-color Line chart demo
- A 3D Line chart demonstration
- An attractive new Horizontal Bar chart demo