Dumbbell variation for the Horizontal Bar chart
Written by Richard Heyes, RGraph author, on 2nd March 2026A new dumbbell variation has been added to the SVG and canvas Horizontal Bar charts.
There's now support for not just the canvas Horizontal Bar chart but also the canvas (vertical) Bar chart, the SVG Horizontal Bar chart and the SVG (vertical) Bar chart too. You can see examples of these in the demos folder of the download archive
A new dumbbell chart variation has been added to the SVG and canvas Horizontal Bar charts as you can see from the image that's shown here. This particular example is a grouped example, which can be achieved by using multiple chart objects (though the code is quite simple - as you can see below the image).
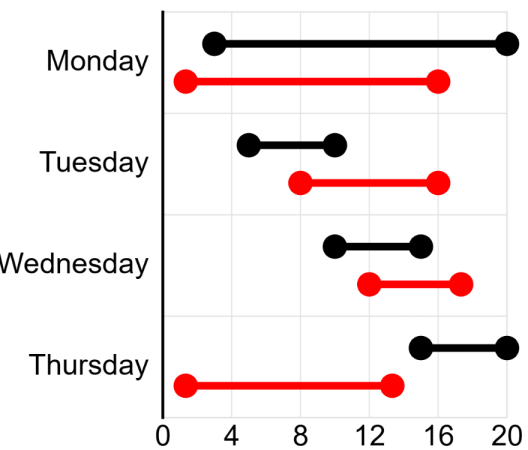
The data for the dumbbell chart is slightly different to a Bar chart in that there are two or more scale values given and these values are the points that you will see marked on the chart. It's unlike a stacked Bar chart where the values are accumulative. For example, with a stacked Bar chart, if you give [3,6,8] you will see bars that go from 0-3, 3-9 and 9-17). Whereas with a dumbbell chart you will see a dumbell that starts at 3, has a section that goes up to 6 and then finishes at 8.
Here's the code that makes the dumbbell chart example above:
<script>
    new RGraph.HBar({
        id: 'cvs',
        data: [0,0,0,0],
        options: {
            yaxisLabels: ['Monday','Tuesday','Wednesday','Thursday'],
            yaxisLinewidth: 3,
            marginLeftAuto: false,
            marginLeft: 200,
            textSize: 23,
            yaxisLabelsOffsetx: -10,
            xaxisScaleMax: 20
        }
    }).draw();


    new RGraph.HBar({
        id: 'cvs',
        data: [[3,20],[5,10],[10,15],[15,20]],
        options: {
            variant: 'dumbbell',
            // variantDumbbellLinewidth: 4,
            // variantDumbbellEndLeft: false,
            // variantDumbbellEndRight: false,
            // variantDumbbellEndLeftRadius: null,
            // variantDumbbellEndRightRadius: null,
            // variantDumbbellEndRadius: 15,
            colors: ['black'],
            textSize: 23,
            yaxisLabelsOffsetx: -5,
            xaxisScale: false,
            backgroundGrid: false,
            xaxisLabelsCount: 4,
            marginLeftAuto: false,
            marginLeft: 200,
            marginTop: 15,
            marginBottom: 55,
            tooltips: ['Jim (b)','Berty (b)','Lois (b)','Cava (b)'],
            tooltipsOffsety: 10
        }
    }).grow();

    new RGraph.HBar({
        id: 'cvs',
        data: [[1,12],[6,12],[9,13],[1,10]],
        options: {
            variant: 'dumbbell',
            colors: ['red'],
            xaxisScale: false,
            backgroundGrid: false,
            marginLeftAuto: false,
            marginLeft: 200,
            marginTop: 55,
            marginBottom: 15,
            marginInner: 35,
            tooltips: ['Jim (r)','Berty (r)','Lois (r)','Cava (r)'],
            tooltipsOffsety: 10
        }
    }).grow();
</script>