The bezierCurveTo function
The bezierCurveTo function is a path function used to add curves to your paths. It takes 6 arguments - two midpoints and the endpoint
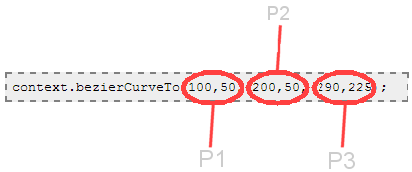
Like the quadraticCurveTo function, the bezierCurveTo function can be used to add curves to your chart. It uses the existing pen position as the start point and then the first two coordinates as the first control point, the second two coordinates as the second control point and the last two coordinates that you give it as the endpoint. The curve that is drawn will not necessarily pass through the control points.
Arguments to the function
- The X1 coordinate (of the first control point, P1 on the diagram)
- The Y1 coordinate (of the first control point, P1 on the diagram)
- The X2 coordinate (of the second control point, P2 on the diagram)
- The Y2 coordinate (of the second control point, P2 on the diagram)
- The X3 coordinate (of the end-point, P3 on the diagram)
- The Y3 coordinate (of the end-point, P3 on the diagram)
P0 is not specified on the bezierCurveTo function - this is done by a moveTo call before the bezierCurveTo call. As shown below.
An example
<script>
    window.onload = function ()
    {
        var canvas  = document.getElementById("cvs");
        var context = canvas.getContext('2d');

        context.beginPath();

        // This is where the curve begins (P0)
        context.moveTo(10, 225);

        context.bezierCurveTo(100,50,200,50,290,225);

        context.stroke();
    }
</script>