About
RGraph is a JavaScript charts library based on
HTML5 SVG and canvas. RGraph is mature (over 18 years
old) and has a wealth of features making it an ideal
choice to use for showing charts on your website.
Version 7.20
Version 7.20 (released in June 2026) is the
latest version of RGraph and the major change in
this version is an update to the default values
of properties making for better looking charts without
having to set any properties.
Read more about this and other changes in
the changelog.
Download
Get the latest version of RGraph (version 7.20, 9th June 2026) from
the download page. You can read the changelog here. There's also older versions available,
minified files and links to cdnjs.com hosted libraries.
Latest forum posts
These are the latest support forum posts that have been
posted or updated.
12th June, Marco
Should I use SVG or canvas for the charts on my website?
9th June, Richard
New version of RGraph: version 7.20
3rd June, Patrick
Question about installing RGraph
1st June, Ouja
How do I add a click event to a bar in my Bar chart?
8th May, Anthony Kuma
Does the SVG Line chart have outofbounds functionality?
License
RGraph can be used for free under the GPL or if
that doesn't suit your situation there's an
inexpensive (£129) commercial license available.The lineCap property
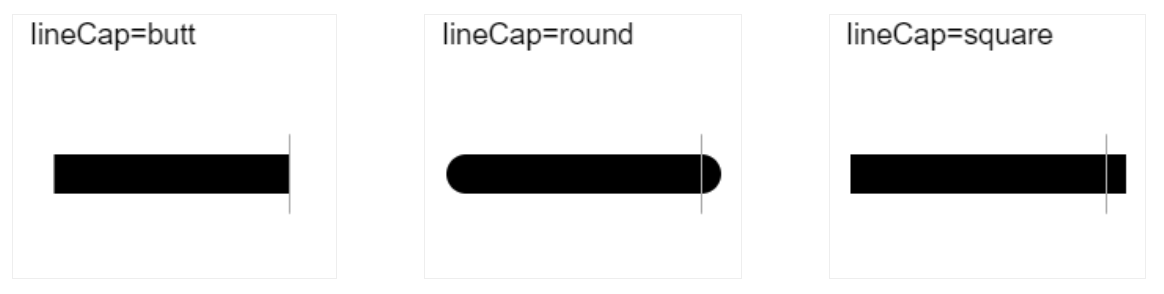
The lineCap property is used to change the way that the ends of lines are drawn. The possible values are butt (default), round and square. Examples of these are shown below. Although the butt and square settings appear to be the same you should note that the square setting has an overhang whilst the butt setting does not.
An example
<script>
window.onload = function ()
{
var canvas = document.getElementById("cvs");
var context = canvas.getContext('2d');
// Translate by half a pixel - this makes lines look crisp
context.translate(0.5, 0.5);
context.beginPath();
context.lineCap = 'butt';
context.lineWidth = 25;
context.moveTo(25,100);
context.lineTo(175,100);
context.stroke();
}
</script>