MENU
.net Powerful JavaScript charts
About
RGraph is a JavaScript charts library based on HTML5 SVG and canvas. RGraph is mature (over 17 years old) and has a wealth of features making it an ideal choice to use for showing charts on your website.

More »


New datagrid in v6.21
In version 6.21 a new datagrid object has been added. This makes it easy to add static or dynamic data tables to your pages. It can be used whether you use the canvas or SVG libraries or entirely standalone.

Read more »


Download
Get the latest version of RGraph (version 6.21, 10th April 2025) from the download page. You can read the changelog here. There's also older versions available, minified files and links to cdnjs.com hosted libraries.

Download »


License
RGraph can be used for free under the GPL or if that doesn't suit your situation there's an inexpensive (£129) commercial license available.

More »

The lineJoin property

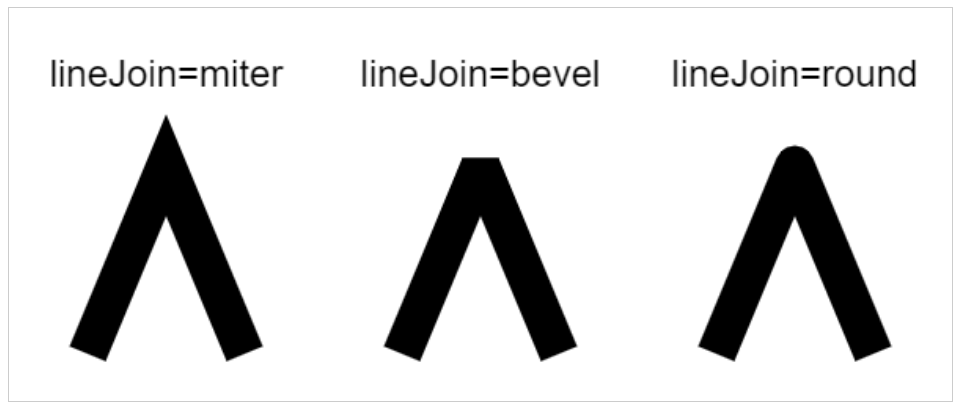
The lineJoin property is used to set how lines are drawn when they are connected. There are three possible values: bevel round and miter. Initially, the setting is miter. Below are examples of the different types.

An example of the different styles of lineJoin

An example

<script>
    window.onload = function ()
    {
        var canvas  = document.getElementById("cvs");
        var context = canvas.getContext('2d');

        // Translate by half a pixel - this makes lines look crisp
        context.translate(0.5, 0.5);
    
        context.beginPath();
        context.lineJoin = 'bevel';
        context.lineWidth = 25;
        context.moveTo(50,150);
        context.lineTo(100,50);
        context.lineTo(150, 150);
        context.stroke();
    }
</script>