The transform function
- Arguments to the function
- An example of scaling your canvas up
- An example of skewing your canvas
- An example of translating your canvas
The transform function can be used to apply matrix transformations to the canvas. What does that mean in practice? It's a combination of scaling, skewing and translating. Of these, scaling can also be done with the scale function, translating can be done with the translate function but skewing (which is slanting the canvas at an angle) can only be done with the transform and setTransform functions. See the examples for how to use this function.
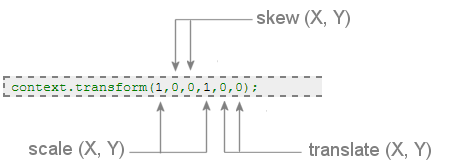
Arguments to the function
- The scale factor(X direction)
- The skew factor (X-axis)
- The skew factor (Y-axis)
- The scale factor(Y direction)
- The translation (X direction)
- The translation (Y direction)
An example of scaling your canvas up
This example uses the transform function (instead of the scale function) to increase the size of the canvas.
<script>
    window.onload = function ()
    {
        var canvas  = document.getElementById("cvs");
        var context = canvas.getContext('2d');

        context.transform(2,0,0,2,0,0);

        var bar = new RGraph.Bar({
            id: 'cvs',
            data: [1,8,6,3,5]
        }).draw();
    }
</script>
An example of skewing your canvas
This example uses the transform function to skew the canvas.
<script>
    window.onload = function ()
    {
        var canvas  = document.getElementById("cvs");
        var context = canvas.getContext('2d');

        context.transform(1,0.2,0.2,1,0,0);

        var bar = new RGraph.Bar({
            id: 'cvs',
            data: [1,8,6,3,5]
        }).draw();
    }
</script>
An example of translating your canvas
This example uses the transform function (instead of the translate function) to move the coordinate system of the canvas by 50 pixels in the horizontal and vertical directions.
<script>
    window.onload = function ()
    {
        var canvas  = document.getElementById("cvs");
        var context = canvas.getContext('2d');

        context.transform(1,0,0,1,50,50);

        var bar = new RGraph.Bar({
            id: 'cvs',
            data: [1,8,6,3,5]
        }).draw();
    }
</script>