MENU
.net Powerful JavaScript charts
About
RGraph is a JavaScript charts library based on HTML5 SVG and canvas. RGraph is mature (over 15 years old) and has a wealth of features making it an ideal choice to use for showing charts on your website.

More »


Download
Get the latest version of RGraph (version 6.19, 28th September 2024) from the download page. You can read the changelog here. There's also older versions available, minified files and links to cdnjs.com hosted libraries.

Download »


License
RGraph can be used for free under the GPL or if that doesn't suit your situation there's an inexpensive (£129) commercial license available.

More »

My Horizontal Bar chart isn't showing all of the totals for the labelsAbove option


Posted by JamesT at 01:52 on Saturday 16th December 2023 [link]
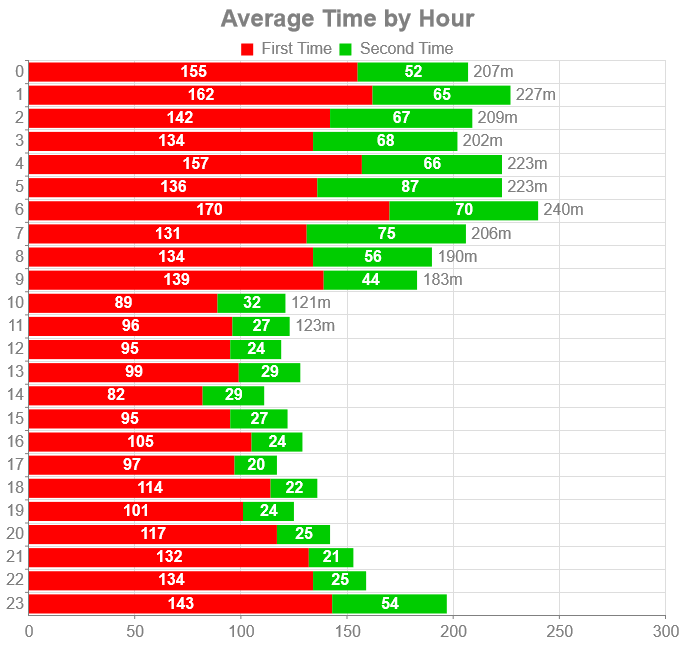
I've created a Horizontal Bar chart and used labelsAbove to get totals printed on the right, but it seems that RGraph stops showing the totals after the 12th bar. Please see attached image.

Is this a bug, or do I need to adjust the options? Here is the code:

    <script>
var data = [ [155,52],
[162,65],
[142,67],
[134,68],
[157,66],
[136,87],
[170,70],
[131,75],
[134,56],
[139,44],
[89,32],
[96,27],
[95,24],
[99,29],
[82,29],
[95,27],
[105,24],
[97,20],
[114,22],
[101,24],
[117,25],
[132,21],
[134,25],
[143,54] ];

        var labels = [0,1,2,3,4,5,6,7,8,9,10,11,12,13,14,15,16,17,18,19,20,21,22,23];


        // Draw the chart
        var bar = new RGraph.HBar({
            id: 'cvs',
            data: data,
            options: {
key: ['First Time','Second Time'],
keyPosition: 'margin',
title: 'Average Time by Hour',
xaxisScaleMax: 300,
xaxisLabelsCount: 6,
backgroundGridVlinesCount: 6,
backgroundGrid: true,

textSize: 12,
textColor: 'gray',
xaxisColor: 'gray',
yaxisColor: 'gray',

marginTop: 60,
labelsAbove: true,
labelsAboveUnitsPost: 'm',
labelsInBar: true,
titleSize: 18,
titleBold: true,
colors: ['red','#0c0'],
grouping: 'stacked',
yaxisLabels: labels,
colorsStroke: 'rgba(0,0,0,0)',
labelsInbar: true,
labelsInbarColor: 'white',
labelsInbarBold: true
            }
        }).draw();
    </script>
Attached image:
Attached image

Posted by Richard at 10:15 on Saturday 16th December 2023 [link]
I think that I may have fixed this in the latest, as yet unreleased, 6.15 version. So you could try the libraries that you can get from GitHub and see if that resolves the issue for you (your chart works fine on my development website). You can get the libraries here:

https://raw.githubusercontent.com/heyesr/rgraph/main/libraries/RGraph.common.core.js
https://raw.githubusercontent.com/heyesr/rgraph/main/libraries/RGraph.common.key.js
https://raw.githubusercontent.com/heyesr/rgraph/main/libraries/RGraph.hbar.js

Let me know how that works out for you. If you need more development libraries you can get them here:

https://github.com/heyesr/rgraph/tree/main/libraries

(click on a file and then click on the RAW link).

HTH.

Posted by JamesT at 23:24 on Monday 18th December 2023 [link]
Those 6.15 files appear to have fixed the issue, thanks Richard. What's the ETA on a 6.15 stable release?

Posted by Richard at 23:27 on Monday 18th December 2023 [link]
The weekend maybe - or perhaps sooner, I went through all the pages on the site checking that they looked OK today. ~1500 pages. That was fun...

[Replies are closed]