MENU
.net Powerful JavaScript charts
About
RGraph is a JavaScript charts library based on HTML5 SVG and canvas. RGraph is mature (over 15 years old) and has a wealth of features making it an ideal choice to use for showing charts on your website.

More »


Download
Get the latest version of RGraph (version 6.19, 28th September 2024) from the download page. You can read the changelog here. There's also older versions available, minified files and links to cdnjs.com hosted libraries.

Download »


License
RGraph can be used for free under the GPL or if that doesn't suit your situation there's an inexpensive (£129) commercial license available.

More »

Issue regarding the xaxisTitle position


Posted by Arpan at 06:20 on Friday 30th September 2022 [link]
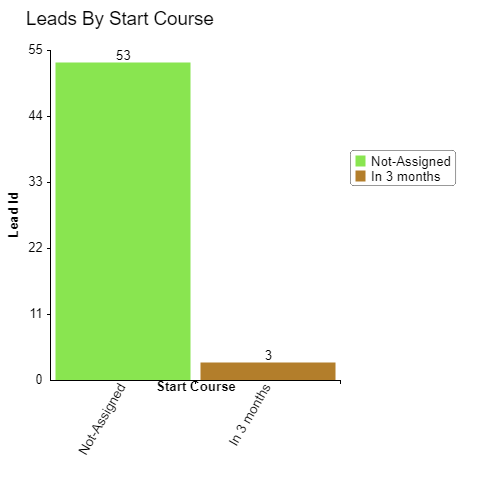
As we want xaxisTitle(lead source shown in image) below xaxis label completed so we are giving xaxixPos:0 it shows xaxisTitle below line and if we give xaxisPos:1 it shows in middle of the labels
I hope revert me with the solution
Attached image:
Attached image

Posted by Richard at 10:40 on Friday 30th September 2022 [link]
By the looks of it, you should have enough space so that you don't have to angle your X-axis labels - so you could remove that - and the xaxisTitlePos=1 should work OK.

Alternatively, if you wish to keep the angled labels you could use the xaxisTitleOffsety property to move the title.

This is probably happening because the text measuring gets a little thrown out because of the angled text.

Here's an example:

https://codepen.io/rgraph/full/LYmdmPz

Posted by Arpan at 07:35 on Monday 3rd October 2022 [link]
Thanks Richard for your response as i tried given solution by you xaxisTitleOffsety to 40 but xaxisTitle is not shown as i want angled text for label

Posted by Richard at 10:08 on Monday 3rd October 2022 [link]
Try also setting the textAccessible option to true because it sounds like the text may be disappearing off the edge of the <canvas>.

Posted by Arpan at 12:45 on Monday 3rd October 2022 [link]
Initially i was using textAccessible as true but it was disappearing labels of xaxis and y axis when i refresh chart so i have used textAccessible to false

Posted by Richard at 13:07 on Monday 3rd October 2022 [link]
Ok, well in that case then the edge of the canvas (which you can easily see by adding a CSS border to it) is the point at which labels will start disappearing.

In that case, you'll need to start increasing the bottom margin - for example:

...
marginBottom: 100
...

Here's an example:

https://codepen.io/rgraph/full/poVKzZW

Posted by Arpan at 06:22 on Tuesday 4th October 2022 [link]
Below code which we used for stacked bar chart:
new RGraph.Bar({
            id: '$chartId',
            data: $chartDataValues,
            options: {
                grouping:'$grouping',
                backgroundGrid:false,
                gutterBottom: 150,
                gutterTop:25,
                gutterLeft:128,
                colorsSequential:true,
                tooltips:$chartTooltips,
                tooltipsEvent:'onmousemove',
                tooltipsCssClass: 'rgraph_chart_tooltips_css',
                shadow:false,
                xaxisLabels: $chartLabelValues,
                yaxisTitle: '$y_name',
                yaxisTitleBold: true,
                titleSize: 14,
                titleX: 25,
                titleY: 20,
                title: '$chartName',
                titleHalign: 'left',
                xaxisTitle: '$x_name',
                xaxisTitleBold: true,
                xaxisTitlePos:0,
xaxisTitleOffsety: 20,
                textSize:10,
                textAngle:90,
                marginLeft: 50,
                marginTop: 50,
                marginBottom: 100,
                marginRight: 160,
                xaxisLabelsAngle:60,
                labelsAbove: true,
                key: $chartLegends,
                keyPosition:'graph',
                keyPositionX:$chartWidth-150,
                keyPositionY:150,
                colors: $this->colours,
        textAccessible: false,
                textAccessibleOverflow: false,
                textAccessiblePointerevents: false,
                ymax:calculateMaxYForSmallNumbers($chartDataValues)
            }
        }).grow({frames: 40});

Posted by Richard at 10:57 on Tuesday 4th October 2022 [link]
You just need to play around with some of the values:

https://codepen.io/rgraph/full/poVKzZW

Posted by Arpan at 11:55 on Tuesday 4th October 2022 [link]
Richard Thanks for the help and solution as i tried with different values and it is working.

[Replies are closed]