About
RGraph is a JavaScript charts library based on
HTML5 SVG and canvas. RGraph is mature (over 18 years
old) and has a wealth of features making it an ideal
choice to use for showing charts on your website.
Version 7.10 released
Version 7.10 (released in January 2026) is the
latest version of RGraph and contains various updates
to the code which you can see on
the changelog page. There's
also a big tidy up in terms of comments and a significant
change to the way that the internal code is referenced which
should lead to a performance improvement in effects and
animations.
New HTML datagrid
In the April 2025 (v6.21) release a new datagrid object
was added.
This makes it easy to add static or dynamic data
tables to your pages. It can be used whether you use the
canvas or SVG libraries or entirely standalone.
Download
Get the latest version of RGraph (version 7.10, 18th January 2026) from
the download page. You can read the changelog here. There's also older versions available,
minified files and links to cdnjs.com hosted libraries.
License
RGraph can be used for free under the GPL or if
that doesn't suit your situation there's an
inexpensive (£129) commercial license available.How can I create a Radial chart with data entry?
Posted by Rachel at 12:31 on Monday 4th September 2023 [link]
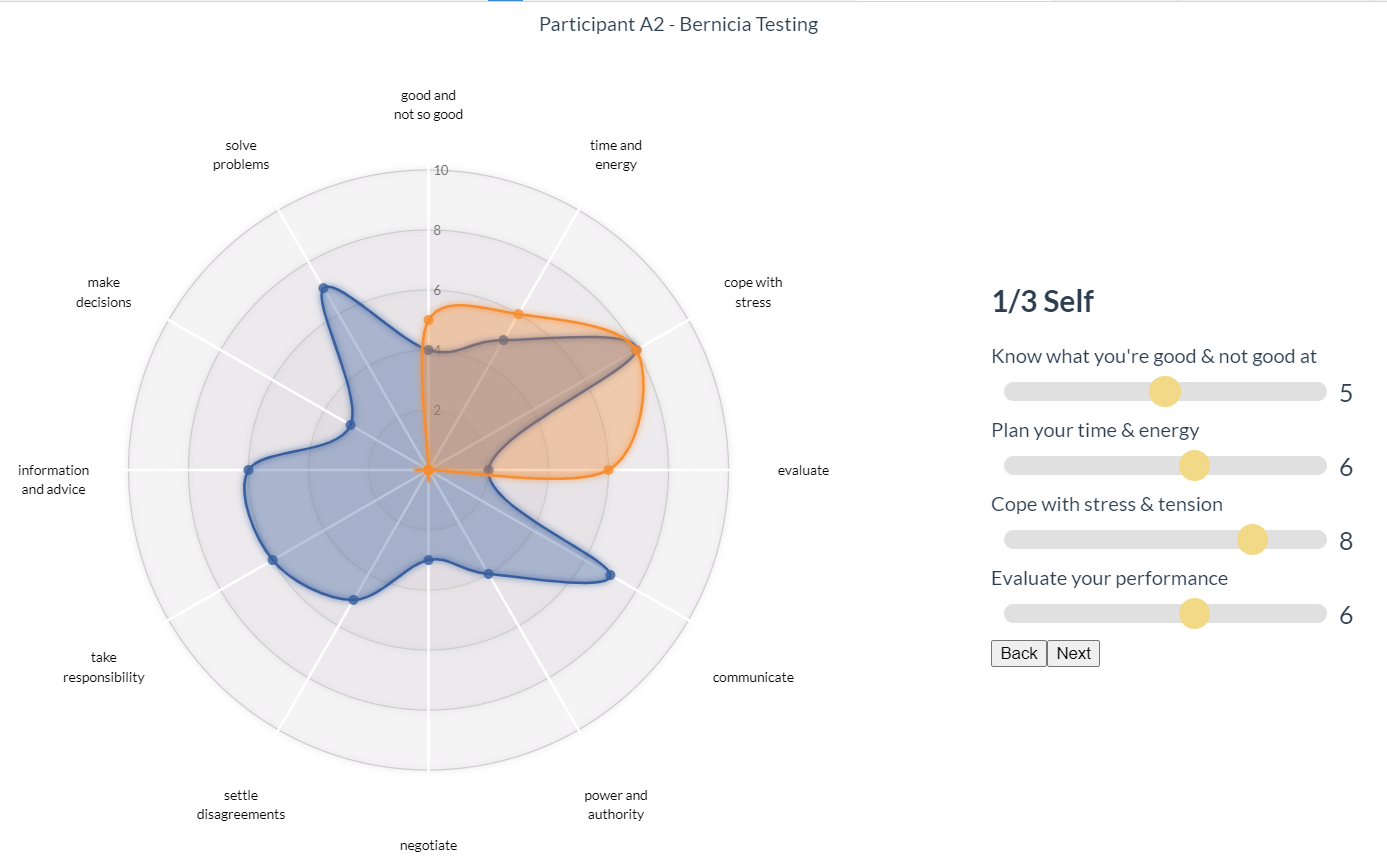
Attached image:
Posted by Richard at 17:02 on Monday 4th September 2023 [link]
Posted by Richard at 20:19 on Monday 4th September 2023 [link]
Posted by Rachel at 18:05 on Thursday 7th September 2023 [link]
[Replies are closed]
